A brief syntax demo

Published

January 1, 2025

Summary

This document provides a brief overview of the features available for authors. It appears in the navigation bar under Demo and exists to help authors during development of their pub. It is removed as a pre-publishing step.

Introduction

This notebook demos some key features. For a more extensive resource, see Quarto’s excellent documentation.

Text

Headers

h1 headers (# <HEADER-TEXT>) are reserved for the title of the pub, so use h2 (## <HEADER-TEXT>) for section titles and h3, h4, etc. for sub-sections.

Callouts

To draw more attention to a piece of text, use callouts:

Important

The most effective way to see the rendered pub is to setup a live preview that re-renders the pub whenever you save this file. Do that with make preview.

Citations & Footnotes

To cite something, add its bibtex entry to ref.bib and then cite it (Avasthi et al., 2024). Here’s another (Lin et al., 2023). For in-depth description of available citation syntax, visit Quarto’s documentation.

Also, don’t forget about footnotes1.

1 To add additional information, like what you’re reading right now, use footnotes.

To create a multi-paragraph footnote, indent subsequent paragraphs. Footnotes can also cite things (Avasthi et al., 2024).

Math

Render math2 using standard \(\LaTeX\) syntax. Inline with $...$ and display with $$...$$.

2 Quarto uses MathJax for math rendering.

\[ e^{ \pm i\theta } = \cos \theta \pm i\sin \theta \tag{1}\]

Euler’s equation (Equation 1) is pretty.

Code

Write code as you would in any Jupyter notebook.

def alertness(hours_sleep, coffees):
    base_alertness = min(hours_sleep / 8 * 100, 100)
    coffee_boost = min(coffees * 30, 60)
    total = min(base_alertness + coffee_boost, 100)
    return round(total, 1)


print("Alertness stats:")
print(f"4hrs sleep + 1 coffee: {alertness(4, 1)}%")
print(f"8hrs sleep + 0 coffee: {alertness(8, 0)}%")
print(f"2hrs sleep + 3 coffee: {alertness(2, 3)}%")
Alertness stats:
4hrs sleep + 1 coffee: 70.0%
8hrs sleep + 0 coffee: 100.0%
2hrs sleep + 3 coffee: 85.0%

Visibility & Placement

Specify per-block instructions with comments at the top of the code block.

Fold the code block (#| code-fold: true):

Source code for this table
import pandas as pd

df = pd.DataFrame({"a": [1, 2, 3], "b": [True, True, False], "c": ["marco", "polo", "marco"]})
df
a b c
0 1 True marco
1 2 True polo
2 3 False marco

Suppress code block visibility while retaining the cell output (#| echo: false):

Note

The code block below runs and the output is visible, but the code itself is absent from the rendering.

The code that generated this print statement is hidden.

Render the output in different places, like in the right margin (#| column: margin):

df
a b c
0 1 True marco
1 2 True polo
2 3 False marco

In general, content placement in highly customizable. For more options, see this Quarto resource.

Annotation

You can annotate lines of code. Lines will reveal their annotation when the user hovers over the circled number on the right hand side of the code block.

def alertness(hours_sleep, coffees):
    base_alertness = min(hours_sleep / 8 * 100, 100)
    coffee_boost = min(coffees * 20, 60)
    total = min(base_alertness + coffee_boost, 100)
    return round(total, 1)
1
Scale to percentage, cap at 100
2
Each coffee adds 20%, max 60% boost
3
Cap total at 100%

For details, see Quarto’s code annotation documentation.

Codebase

You can choose to either fold (#| code-fold: true) or supress (#| echo: false) code snippets that distract from the narrative. However, if you’ve written an extensive amount of code, it may be more practical to define it in a package that this notebook imports from, rather than defining it in the notebook itself. This project is already set up to import from packages found in the src/ directory, so place any such code there. As an example, this code block imports code from a placeholder analysis package found at src/analysis.

from analysis import polo_if_marco

polo_if_marco("marco")
'polo'

If you want to package any of your code for the purposes of simplifying this notebook, replace the contents of src/analysis/ with your own package.

Figures & Tables

Captions & Labeling

In general, if a cell output is a figure or table, you should caption and label it.

df
Table 1: This is a small table.
a b c
0 1 True marco
1 2 True polo
2 3 False marco

This is how you reference Table 1.

Note

If the cell output is a table, the label ID should be prefixed with tbl-. If it’s a figure, prefix with fig-.

For example, a table could be captioned and labeled with:

#| label: tbl-small-table
#| tbl-cap: "This is a small table."

And a figure could be captioned and labeled with:

#| label: fig-some-figure
#| fig-cap: "This is some figure."

If your code block produces several plots, you can subcaption each:

import matplotlib.pyplot as plt
import numpy as np


def random_plot():
    plt.figure()
    plt.scatter(np.random.rand(10), np.random.rand(10), marker="o")
    plt.tight_layout()
    plt.show()
    plt.close()


for _ in range(4):
    random_plot()
Add brief alt text: [Chart type] of [type of data] where [reason for including].
(a) This is the first plot.
Second scatter plot of 10 random points showing uniform distribution with no correlation.
(b) This is the second.
Third scatter plot of 10 random points showing uniform distribution with no correlation.
(c) The third.
Fourth scatter plot of 10 random points showing uniform distribution with no correlation.
(d) And finally, here’s the fourth.
Figure 1: A panel of scatter plots.

Figure 1 is just one example layout for multi-panel figures. For more customization options, see Quarto’s documentation on figures.

Interactivity

Interactive widgets can be used. For example, Plotly:

import plotly.express as px

df = px.data.gapminder()
px.scatter(
    df,
    x="gdpPercap",
    y="lifeExp",
    animation_frame="year",
    animation_group="country",
    size="pop",
    color="continent",
    hover_name="country",
    log_x=True,
    size_max=55,
    range_x=[100, 100000],
    range_y=[25, 90],
)
Note

It’s possible that your local preview fails to render the above widget, and you instead see something to the effect of:

Unable to display output for mime type(s): application/vnd.plotly.v1+json

If you want to see how your widget renders within the pub, run make execute and then start a new preview (make preview).

References

Avasthi P, Hochstrasser ML, Roth R. (2024). Early update on Arcadia publishing 2.0: Scientists are in charge, speed is an issue
Lin Z, Akin H, Rao R, Hie B, Zhu Z, Lu W, Smetanin N, Verkuil R, Kabeli O, Shmueli Y, Santos Costa A dos, Fazel-Zarandi M, Sercu T, Candido S, Rives A. (2023). Evolutionary-scale prediction of atomic-level protein structure with a language model. https://doi.org/10.1126/science.ade2574
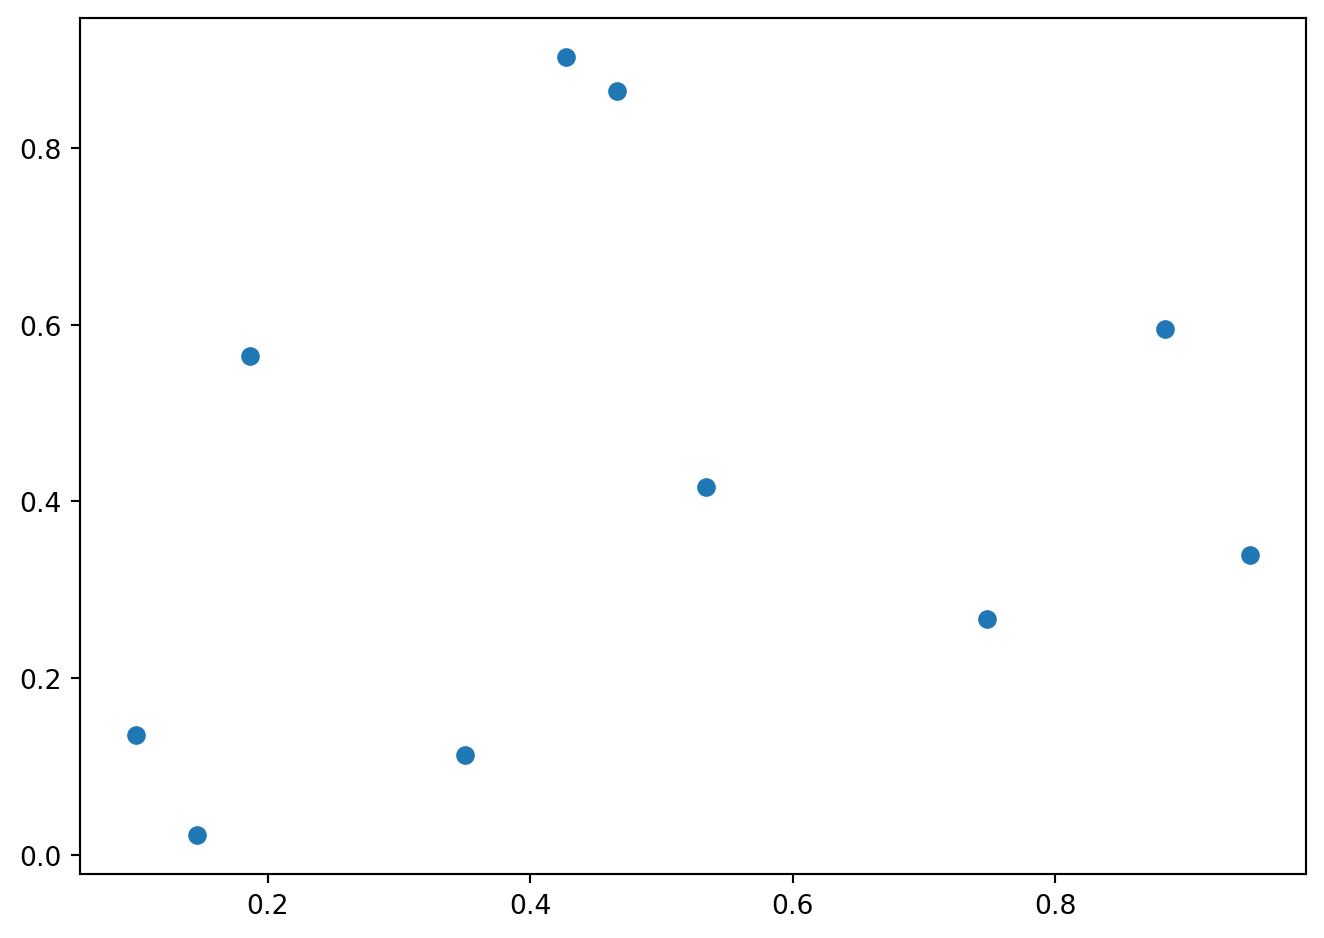
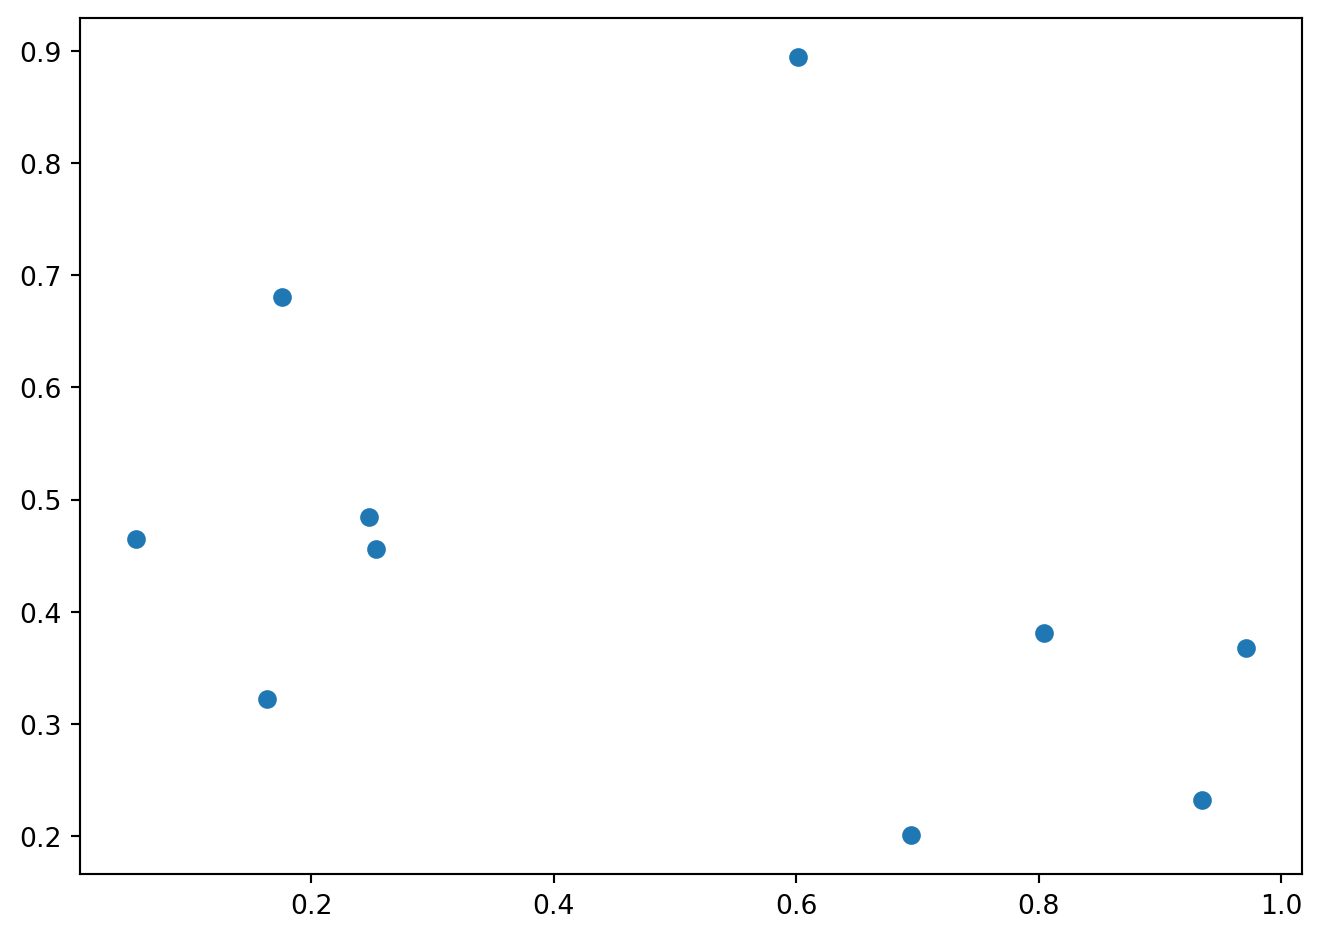
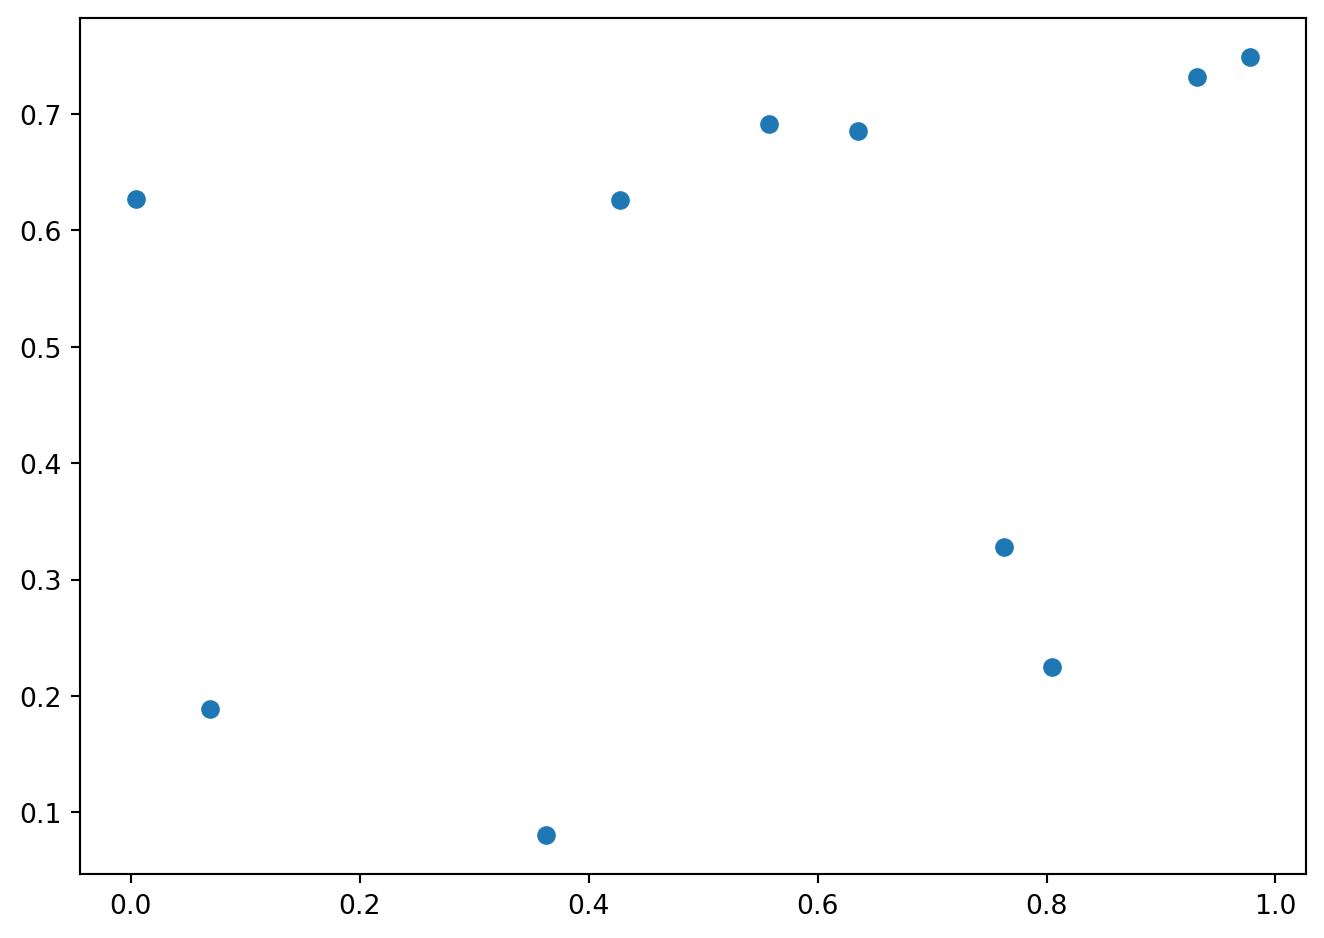